Mar 20, 2012

Finite Precision and Statistical Models


If you aren't already familiar with some of the common errors in statistical modeling, I highly recommend Peter Kennedy's A Guide to Econometics.  This post is about a modeling issue that I haven't read in any book yet, but seen a couple of times in person.

The issue is caused by precision. Maybe the reason I haven't read this in a book is because precision issues are applied instead of academic concerns. Most of the analysis of statistical model fitting is done with the real number system, which leaves out precision from consideration. Still, finite precision becomes a problem for models around their steep points. Consider this S shaped curve that gives the relationship between two variables:


It is steep in some parts and very shallow in others.  Any uncertainty in the value of one variable implies an uncertainty in the value of the other variable. The uncertainty grows when the derivative of the curve is greater than 1 and shrinks when it is less than one. In other words the same amount of uncertanty in the value of the independent variable (x-value) produces different amounts of uncertanty in the value of the dependent variable (y-value). We are more uncertan about the value of the dependent variable when the curve is steep (derivative greater than 1) and more certain about its value when it is shallow. You can see this in the graph below:

Though the red and green lines span the same region on the independent variable's axis (x-axis), red spans a larger section of the dependent variable's axis (y-axis). Any uncertanty around the red region is magnified considerably. This S shape curve will be problematic because of this.

Consider a set of data that is taken from this curve plus some constant random noise. I've basically defined a homoskedastic data set which is great. But if there is any uncertanty in the independent values as we measured it, then the noise added to the dependent values effectively becomes larger where the model is steep, even if the uncertainty in the value of x is constant. Here is what the set of data looks like for 500 points if there was a Gaussian noise on the dependent values and some smaller Gaussian noise on the independent values.


The curve is so much thicker in the middle. It's heteroskedastic. If instead of Gaussian noise in the independent values we simply rounded the independent values,  we would get the same problem.


Thicker in the middle. Compare this to no noise our rounding in the independent data.


This is homoskedastic. It's an example that you would see in a textbook and is completely unrealistic compared to the first two data sets.

If we try to fit anything to the first two sets of data, the elements in the middle will have a stronger influence on the result than the rest of the data because of the increased variance in the middle of the S shape. That might not look so bad for this data set, but what about replacing our S curve with 1/x or Log(x)? With these, values close to 0 will have an incredible weight in determining the value of a least squares regression.

How many people are really even thinking about these kinds of things when they use statistical models?

Here's some Mathematica code used to generate the three sets from the plots above in order. The S curve is 10*ArcTan(x).

xsamples = RandomReal[{-5, 5}, 500]; 
firstSet =
 Transpose@{xsamples + RandomVariate[NormalDistribution[0, 0.2], 500],
    10 Tanh[xsamples] +
    RandomVariate[NormalDistribution[0, 0.2], 500]}; 
secondSet =
 Transpose@{Round[xsamples, 0.5],
   10 Tanh[xsamples] + RandomVariate[NormalDistribution[0, 0.2], 500]}; 
thirdSet =
  Transpose@{xsamples,
    10 Tanh[xsamples] +
     RandomVariate[NormalDistribution[0, 0.2], 500]};

Mar 17, 2012

The Creative Class

I keep on seeing articles and blogs about the importance of being a content creator. This is actually one of Johnathan Zittrain's big principals for the internet -  we need tech which allow us to create content and not tech which only allows us to consume it.

But more recently, curation as an alternative to content creation has become popular. Pinterest and Tumblr are both examples of this category. Hell so are search engines. Content curation is possible with many more kinds of devices than creation. It can be done using mobile devices and takes advantage passive interaction (Read Wu-Wei)  such as page views.

The shift to curation is in part a response to a saturation of information on the internet. Search engines are data curation. I am hardly qualified to create new content that is worth much except in a few small areas. This blog for example is fairly worthless.

A bit more on the dark side, maybe we should flip how we think about curation from collecting good content to destroying bad content. We should be talking about content destruction. People are reluctant to see that more content is often destructive. Curation is only useful because it filters out worthless data.

Worthless data we keep on ourselves can also come back to hurt us later through data mining.

Nov 21, 2011

Random Name Generator

The graphic on the right shows the 100 most common male names in America where the size of  each name is proportional to its popularity. The graphic is a ton more compelling as an interactive 3D document, but the picture conveys the main idea of how name popularity is distributed.

The difficulty in making an image like this, or anything like it really isn't in programming it. The program which was used to generate it is very simple. More difficult is acquiring the data.  In this case, I was able to acquire the data from Wolfram|Alpha in a computable format with very little work.

For exploratory programming, acquiring data to work with is probably one of the most important issues.  This is something not well addressed by most higher level programming languages. For them, the data which the code acts on is a secondary feature of the language rather than seen as an integral part of it.

Once I have access to the data, I am able to do a ton of difficult things that I would not normally be able to do. I can create a random name generator that returns realistic names back to me in the same proportion I would likely find them in the real world.

Despite the fact that the internet has brought us a ton of data to work with, finding what you want in a computable format is still very difficult.  Wasn't the semantic web supposed to fix that by assigning meaning to the data?

Nov 9, 2011

Random thoughts on design methods

 I've been thinking just now about how my style of programming has changed since going to college. My current work doesn't really lend itself to being called software engineering, but I do a fair amount of programming in it - usually in fairly small pieces. But even my programming outside of work has changed a bit.

I don't really create programs anymore. Programs are restricted in what they can do. I thought for a while that I was instead creating libraries for programming. After a while though, I realized that wasn't the case either. To a certain degree, I try to think about my packages as domain specific languages. I think about creating a way to write out common concepts I need to express and build the underlying functionality in a way that will be flexible. Only after doing this a ton do I begin actually writing the thing I want.

Maybe this is just something I never really got about programming before.

But I'm not sure what it is I am really understanding except the concept of a programming language is still underrated. 


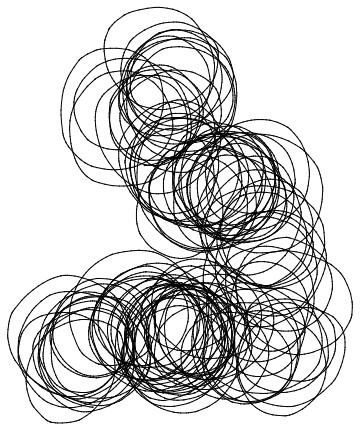
MakeTurtle[] := Turtle[{0.,0.},0.,{}]; MakeTurtle[loc_,angle_,lines_]:=Turtle[loc,angle,lines];

Location[trtl_]:=trtl[[1]]; Angle[trtl_]:=trtl[[2]]; Lines[trtl_]:=trtl[[3]];

Move[trtl_,distance_]:=With[{newLoc = Location@trtl+distance*Cos[Angle@trtl],Sin[Angle@trtl]})},
MakeTurtle[newLoc,Angle@trtl,Append[Lines@trtl,Line[{Location@trtl,newLoc}]]]]

Move[distance_]:=Function[trtl,Move[trtl,distance]];
TurnRight[trtl_,angle_]:= MakeTurtle[Location@trtl,Angle@trtl+angle,Lines@trtl];

TurnRight[angle_]:=Function[trtl,TurnRight[trtl,angle]];
TurnLeft[trtl_,angle_]:= MakeTurtle[Location@trtl,Angle@trtl-angle,Lines@trtl];TurnLeft[angle_]:=Function[trtl,TurnLeft[trtl,angle]];

ShowTurtle[trtl_]:=Graphics@Lines@trtl;

trtl:=Nest[(#//TurnRight[RandomReal[{0,2Pi}]]//Move[RandomVariate[NormalDistribution[0,1]]])&,MakeTurtle[],300];

Nov 2, 2011

Some thoughts on usability of software and interfaces


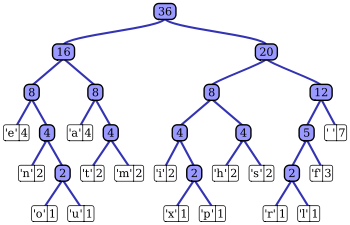
 Usability seems to have a ton in common Huffman coding trees. If you are not familiar with them, take a look at the wikipedia article. Roughly speaking, a Huffman coding is a way of assigning smaller symbols to the most common elements of a signal and larger symbols to less common elements of a signal. By doing this, you can get a representation of the signal which is of a minimal size, the Huffman encoding.

A good programming language for example will be a lot like a Huffman encoding. The more common a task is, the easier it should be to accomplish in that programming language. There are, of course, forces pushing to make any programming language more verbose, such as readability and desire for specificity. But this at least offers a good explanation for why there should be so many programming languages - different languages are different codings for tasks we may wish to do. Novices to programming languages wonder why there is such a diversity of programming languages since to them it seems that there is a sharp cost in learning a new programming language and that all programming languages are essentially equivalent in power (Turing complete). They attribute the diversity of programming languages to either factionalism caused by corporations or the idea that progress has been made in the design of languages, which creates new languages while legacy ones remain to and require maintenance. There is of course truth in both of these. 

Not only does the Huffman code analogy help explain why there would be different languages for different areas, but it explains that some languages have different learning curves. By making it easy  to do common tasks, it necessarily makes it a bit harder to do less common tasks. Many programming languages seem hard then because they try to make a large set of tasks possible with them. Take for example spread sheet programs like Microsoft's Excel. They make it very easy to make graphs of data, but it is very difficult to get highly customized graphics. In fact, there are a large number of graphics which are basically impossible to make. Creating a simple graphic with a programming language like R, Python, or Mathematica though is more difficult than doing the same task with a spreadsheet. For this reason, people new to programming think that programming languages are needlessly difficult. However, when the graphs have to be customized in some way, they are likely to find they have much more freedom and can manage much more customization with a programming language than they could have with spreadsheet. In this way, programming languages resemble Huffman coding trees that are more well balanced than more task specific programs. 

The analogy with Huffman coding trees does not only extend to programming languages but other kinds of interfaces as well. Consider a simple user interface. If a certain task is more common, we can choose to make a button to perform that task more prominent than others perhaps by making it bigger or placing it at the top of a list. By doing this, we have made the other capabilities of the interface a bit harder to find. In this sense there is an encoding for the action and other actions have a longer encoding. 


Aug 17, 2011

Old Dog, New Trick

I've been using integration by parts lately to solve some unique problems. Unfortunately, it seems many people don't seem to think there is anything really interesting about it. I would like to show here a simple example of some of its more complicated things I've done with it recently.

First to start off with a quick definition of the integration by parts transformation.

\int a b \, dx=(\int a \, dx) b-\int (\int a \, dx) \frac{db}{dx} \, dx

This transformation is kinda useful for numerical integration as well. If you look at the right hand side, you'll see that a always appears integrated. For this reason, we can use this interpretation of the integral whenever the integral of a is better behaved than a itself.  Take this integral as an example:


This equation has no analytic solution and becomes very difficult to analyse numerically around 0. In fact a simple attempt to numerically integrate it won't give good results.

The oscillations are due to that problematic sine term. The amazing thing is how much better behaved the integral of sine(1/x) is than the original expression. The integral has an analytic solution in terms of  the Cosine Integral function: http://mathworld.wolfram.com/CosineIntegral.html. This function is not difficult to numerically approximate.

We can then make this integral easier to solve numerically by applying the integration by parts transformation. "a" here will be Sin(1/x) and "b" will be the exponential. First we compute the Integral of a. First I define the integral of the oscillating function:


Here Ci is the previously mentioned CosineIntegral function.  The full transformed integral is:


oI still oscillates, but not as widely as the previous function. This integral is easy to evaluate numerically. If we take out the analytic component and just focus on the integral, we can see we basically just transformed the function in the graph above into an analytically evaluable expression and the integral of this function:

I'm always kind of amazed what kinds of functions this technique can be applied to.

Aug 7, 2011

Some fun consequences of the previous post on Cauchy distributions

Look at my kinda rant on stack exchange here.

Essentially, the theory of diversification for stocks is completely different if you assume that the differentials of stocks are Cauchy distributed instead of Normally distributed. In fact, as I kinda point out, diversification doesn't even seem to make any sense under the conditions that stocks are levy processes.

There were a number of good answers and its gonna take me a while to go through the recommended reading.