
Aug 10, 2012
Aug 6, 2012
Hilbert Disco
The Hilbert curve has the interesting property that points local on the plane are likely to be local on the Hilbert curve as well.
The image below is a colored square. Each square is colored in a sequence along the Hilbert curve. This gives the image the nice property that it has many patterns in it, but still sufficiently complex that it isn't just a pattern. It looks a bit random.

The image below is a colored square. Each square is colored in a sequence along the Hilbert curve. This gives the image the nice property that it has many patterns in it, but still sufficiently complex that it isn't just a pattern. It looks a bit random.

May 19, 2012


Apr 30, 2012
Stock Visualization
I've never really liked stock visualizations. Most visualizations don't seem to compare the stocks against the market. Even those that do are often too short term to see the global behavior of the stock.
The images below are Log-Log plots of individual stocks against the Dow Jones industrial average over the course of each stocks lifespan. The log value of the Dow Jones is on the bottom axis and the value of the stock is on the log value of the stock is the on the vertical axis. The red dot is the current value of the stock.
Stocks do well if the line trends to the top of the chart. The market in general is doing well if it trends to the right. Over time all these graphs trend to the right and the top since I've selected for successful companies.
Maybe the most interesting stocks to look at this way are the older ones.
This is GE. GE has been stably rising alongside the index for much of its mature life except recently. This seems to be true of most stocks. The graphs somewhat look like flowers. The stem of the flower ends around 1997 and the flower begins, signalling that the stock became much less correlated with the Dow Jones.
This plot is for Walmart which shows essentially the same structure as GE above.
IBM is another older stock. You can see the flower at the top left, but it looks like the stock might have recently left the flower head for good.
Microsoft pretty clearly shows the flower pattern, but it not clear that it is leaving the flower region at the top of the stalk.
Apple is a great counter example. The stock was doing pretty poorly most of life until recently. There is no flower pattern in this stock. Things are must less clear in newer companies which have no stalk.
Google's growth has been mostly vertical because it was grown while the Dow Jones hasn't. It's still possible to see though that the value of Google is effected by the Dow Jones, though weakly in how its flower slants.
Compare that to Amazon though. The leaves in its flower are completely horizontal. The changes in the Dow Jones don't seem to affect its value and it climbs up slowly despite them.
The images below are Log-Log plots of individual stocks against the Dow Jones industrial average over the course of each stocks lifespan. The log value of the Dow Jones is on the bottom axis and the value of the stock is on the log value of the stock is the on the vertical axis. The red dot is the current value of the stock.
Stocks do well if the line trends to the top of the chart. The market in general is doing well if it trends to the right. Over time all these graphs trend to the right and the top since I've selected for successful companies.
Maybe the most interesting stocks to look at this way are the older ones.
 |
| GE |
 |
| Walmart |
 |
| IBM |
 |
| Microsoft |
Microsoft pretty clearly shows the flower pattern, but it not clear that it is leaving the flower region at the top of the stalk.
 |
| Apple |
 |
 |
| Amazon |
Compare that to Amazon though. The leaves in its flower are completely horizontal. The changes in the Dow Jones don't seem to affect its value and it climbs up slowly despite them.
So what do these visualizations mean?
Nothing. They're just another stupid stock visualization.
Apr 25, 2012
Good-bye Sweet Silence
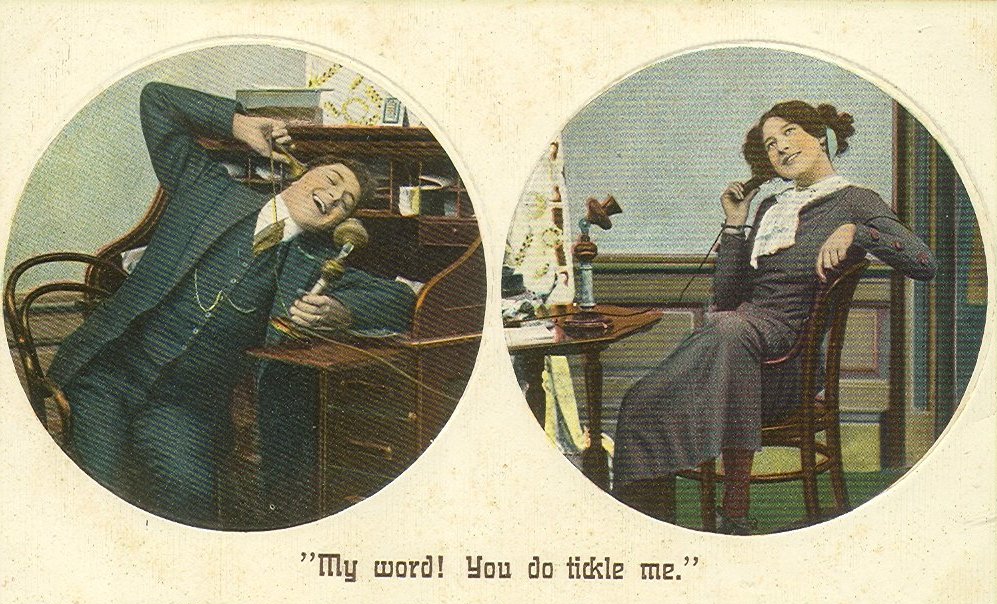
Smart phones are the dead end of both personal ownership and communal property. They provide no hope for a democracy of creativity on the internet or privacy. They are only a poor fix for our need for friendship and communication.
I've inconvienced my friends and family for a long time with my refusal to get a modern cell phone. Most have been kind of enough to put up with it, but I can't go on. It's impossible to be really free.
Politeness and Machines

An automatic checkout machine just asked me:
¨Have you swiped your member card yet?¨
This of course caused me to pause and consider what the machine was telling me. The sentence is actually really complicated, but it's just a polite way of saying:
"Swipe your damn card."
The polite version just doesn't work for me though. When anyone says something like it, they are relying on plausible deniability. They might not be sure whether you have swiped it or not. So they can say this without seeming demanding. They can plausibly deny having any knowledge of whether you have done this or not.
The machine however has no plausible deniability. It knows whether you have or not. The fact that it tries to get away with the plausible denial seems to make it unnaturally rude. Instead, it's very clear that it knows you have not swiped it and comes off as very insincere.
Anyway, I got yelled at in the automatic checkout lane today for thinking too much about the linguistics of politeness and how it affects machines. The last chapter of Pinker's "The Stuff of Thought" has some good material on the subject.
"Swipe your damn card."
The polite version just doesn't work for me though. When anyone says something like it, they are relying on plausible deniability. They might not be sure whether you have swiped it or not. So they can say this without seeming demanding. They can plausibly deny having any knowledge of whether you have done this or not.
The machine however has no plausible deniability. It knows whether you have or not. The fact that it tries to get away with the plausible denial seems to make it unnaturally rude. Instead, it's very clear that it knows you have not swiped it and comes off as very insincere.
Anyway, I got yelled at in the automatic checkout lane today for thinking too much about the linguistics of politeness and how it affects machines. The last chapter of Pinker's "The Stuff of Thought" has some good material on the subject.
Apr 9, 2012
Why I don't like the verb "to teach"
So
是以
Sages manage the work of detached actions
聖人處無爲之事
Conduct the teaching of no words
行不言之敎
They work with myriad things but do not control
萬物作焉而不辭
They create but do not possess
生而不有
"Teaching" is an extraordinary word. Few words can twist the meaning of a sentence like it does. Consider the sentence:
"Teachers teach students."
This sentence does more than just convey that education is happening. It frames the meaning of it. The teacher actively gives the education. The student passively receives it. Education is done to the students.
And for the most part, that is how we teach and think about teachers. It is so ingrained that you can see this giving-and-receiving metaphor in the design of classrooms. The metaphor is so hard to escape because the design of our environment affects our behavior.
But consider the word "learning" instead. Students can learn from a teacher, just as they could learn from a book. "Learning" frames education in a way that values effort and participation from students. The best teachers I have had didn't teach. They created environments for learning and simply let it happen.
是以
Sages manage the work of detached actions
聖人處無爲之事
Conduct the teaching of no words
行不言之敎
They work with myriad things but do not control
萬物作焉而不辭
They create but do not possess
生而不有
"Teaching" is an extraordinary word. Few words can twist the meaning of a sentence like it does. Consider the sentence:
"Teachers teach students."
This sentence does more than just convey that education is happening. It frames the meaning of it. The teacher actively gives the education. The student passively receives it. Education is done to the students.
And for the most part, that is how we teach and think about teachers. It is so ingrained that you can see this giving-and-receiving metaphor in the design of classrooms. The metaphor is so hard to escape because the design of our environment affects our behavior.
But consider the word "learning" instead. Students can learn from a teacher, just as they could learn from a book. "Learning" frames education in a way that values effort and participation from students. The best teachers I have had didn't teach. They created environments for learning and simply let it happen.
Mar 20, 2012
Finite Precision and Statistical Models
If you aren't already familiar with some of the common errors in statistical modeling, I highly recommend Peter Kennedy's A Guide to Econometics. This post is about a modeling issue that I haven't read in any book yet, but seen a couple of times in person.
The issue is caused by precision. Maybe the reason I haven't read this in a book is because precision issues are applied instead of academic concerns. Most of the analysis of statistical model fitting is done with the real number system, which leaves out precision from consideration. Still, finite precision becomes a problem for models around their steep points. Consider this S shaped curve that gives the relationship between two variables:


Though the red and green lines span the same region on the independent variable's axis (x-axis), red spans a larger section of the dependent variable's axis (y-axis). Any uncertanty around the red region is magnified considerably. This S shape curve will be problematic because of this.
Consider a set of data that is taken from this curve plus some constant random noise. I've basically defined a homoskedastic data set which is great. But if there is any uncertanty in the independent values as we measured it, then the noise added to the dependent values effectively becomes larger where the model is steep, even if the uncertainty in the value of x is constant. Here is what the set of data looks like for 500 points if there was a Gaussian noise on the dependent values and some smaller Gaussian noise on the independent values.

The curve is so much thicker in the middle. It's heteroskedastic. If instead of Gaussian noise in the independent values we simply rounded the independent values, we would get the same problem.

Thicker in the middle. Compare this to no noise our rounding in the independent data.

This is homoskedastic. It's an example that you would see in a textbook and is completely unrealistic compared to the first two data sets.
If we try to fit anything to the first two sets of data, the elements in the middle will have a stronger influence on the result than the rest of the data because of the increased variance in the middle of the S shape. That might not look so bad for this data set, but what about replacing our S curve with 1/x or Log(x)? With these, values close to 0 will have an incredible weight in determining the value of a least squares regression.
How many people are really even thinking about these kinds of things when they use statistical models?
Here's some Mathematica code used to generate the three sets from the plots above in order. The S curve is 10*ArcTan(x).
xsamples = RandomReal[{-5, 5}, 500];
firstSet =
Transpose@{xsamples + RandomVariate[NormalDistribution[0, 0.2], 500],
10 Tanh[xsamples] +
RandomVariate[NormalDistribution[0, 0.2], 500]};
secondSet =
Transpose@{Round[xsamples, 0.5],
10 Tanh[xsamples] + RandomVariate[NormalDistribution[0, 0.2], 500]};
thirdSet =
Transpose@{xsamples,
10 Tanh[xsamples] +
RandomVariate[NormalDistribution[0, 0.2], 500]};
Mar 17, 2012
The Creative Class
I keep on seeing articles and blogs about the importance of being a content creator. This is actually one of Johnathan Zittrain's big principals for the internet - we need tech which allow us to create content and not tech which only allows us to consume it.
But more recently, curation as an alternative to content creation has become popular. Pinterest and Tumblr are both examples of this category. Hell so are search engines. Content curation is possible with many more kinds of devices than creation. It can be done using mobile devices and takes advantage passive interaction (Read Wu-Wei) such as page views.
The shift to curation is in part a response to a saturation of information on the internet. Search engines are data curation. I am hardly qualified to create new content that is worth much except in a few small areas. This blog for example is fairly worthless.
A bit more on the dark side, maybe we should flip how we think about curation from collecting good content to destroying bad content. We should be talking about content destruction. People are reluctant to see that more content is often destructive. Curation is only useful because it filters out worthless data.
Worthless data we keep on ourselves can also come back to hurt us later through data mining.
But more recently, curation as an alternative to content creation has become popular. Pinterest and Tumblr are both examples of this category. Hell so are search engines. Content curation is possible with many more kinds of devices than creation. It can be done using mobile devices and takes advantage passive interaction (Read Wu-Wei) such as page views.
The shift to curation is in part a response to a saturation of information on the internet. Search engines are data curation. I am hardly qualified to create new content that is worth much except in a few small areas. This blog for example is fairly worthless.
A bit more on the dark side, maybe we should flip how we think about curation from collecting good content to destroying bad content. We should be talking about content destruction. People are reluctant to see that more content is often destructive. Curation is only useful because it filters out worthless data.
Worthless data we keep on ourselves can also come back to hurt us later through data mining.
Nov 21, 2011
Random Name Generator

The difficulty in making an image like this, or anything like it really isn't in programming it. The program which was used to generate it is very simple. More difficult is acquiring the data. In this case, I was able to acquire the data from Wolfram|Alpha in a computable format with very little work.
For exploratory programming, acquiring data to work with is probably one of the most important issues. This is something not well addressed by most higher level programming languages. For them, the data which the code acts on is a secondary feature of the language rather than seen as an integral part of it.
Once I have access to the data, I am able to do a ton of difficult things that I would not normally be able to do. I can create a random name generator that returns realistic names back to me in the same proportion I would likely find them in the real world.
Despite the fact that the internet has brought us a ton of data to work with, finding what you want in a computable format is still very difficult. Wasn't the semantic web supposed to fix that by assigning meaning to the data?
Nov 9, 2011
Random thoughts on design methods

I don't really create programs anymore. Programs are restricted in what they can do. I thought for a while that I was instead creating libraries for programming. After a while though, I realized that wasn't the case either. To a certain degree, I try to think about my packages as domain specific languages. I think about creating a way to write out common concepts I need to express and build the underlying functionality in a way that will be flexible. Only after doing this a ton do I begin actually writing the thing I want.
Maybe this is just something I never really got about programming before.

But I'm not sure what it is I am really understanding except the concept of a programming language is still underrated.
MakeTurtle[] := Turtle[{0.,0.},0.,{}]; MakeTurtle[loc_,angle_,lines_]:=Turtle[loc,angle,lines];
Location[trtl_]:=trtl[[1]]; Angle[trtl_]:=trtl[[2]]; Lines[trtl_]:=trtl[[3]];
Move[trtl_,distance_]:=With[{newLoc = Location@trtl+distance*Cos[Angle@trtl],Sin[Angle@trtl]})},
MakeTurtle[newLoc,Angle@trtl,Append[Lines@trtl,Line[{Location@trtl,newLoc}]]]]
Move[distance_]:=Function[trtl,Move[trtl,distance]];
TurnRight[trtl_,angle_]:= MakeTurtle[Location@trtl,Angle@trtl+angle,Lines@trtl];
TurnRight[angle_]:=Function[trtl,TurnRight[trtl,angle]];
TurnLeft[trtl_,angle_]:= MakeTurtle[Location@trtl,Angle@trtl-angle,Lines@trtl];TurnLeft[angle_]:=Function[trtl,TurnLeft[trtl,angle]];
ShowTurtle[trtl_]:=Graphics@Lines@trtl;
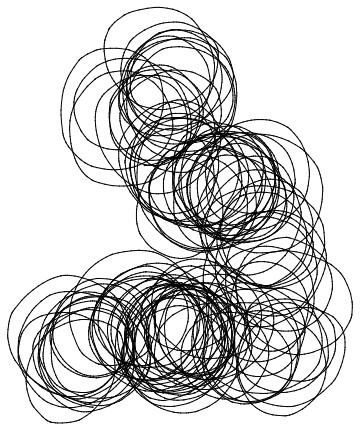
trtl:=Nest[(#//TurnRight[RandomReal[{0,2Pi}]]//Move[RandomVariate[NormalDistribution[0,1]]])&,MakeTurtle[],300];
Nov 2, 2011
Some thoughts on usability of software and interfaces
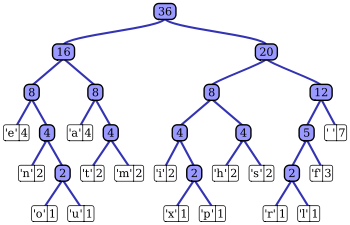 |
A good programming language for example will be a lot like a Huffman encoding. The more common a task is, the easier it should be to accomplish in that programming language. There are, of course, forces pushing to make any programming language more verbose, such as readability and desire for specificity. But this at least offers a good explanation for why there should be so many programming languages - different languages are different codings for tasks we may wish to do. Novices to programming languages wonder why there is such a diversity of programming languages since to them it seems that there is a sharp cost in learning a new programming language and that all programming languages are essentially equivalent in power (Turing complete). They attribute the diversity of programming languages to either factionalism caused by corporations or the idea that progress has been made in the design of languages, which creates new languages while legacy ones remain to and require maintenance. There is of course truth in both of these.
Not only does the Huffman code analogy help explain why there would be different languages for different areas, but it explains that some languages have different learning curves. By making it easy to do common tasks, it necessarily makes it a bit harder to do less common tasks. Many programming languages seem hard then because they try to make a large set of tasks possible with them. Take for example spread sheet programs like Microsoft's Excel. They make it very easy to make graphs of data, but it is very difficult to get highly customized graphics. In fact, there are a large number of graphics which are basically impossible to make. Creating a simple graphic with a programming language like R, Python, or Mathematica though is more difficult than doing the same task with a spreadsheet. For this reason, people new to programming think that programming languages are needlessly difficult. However, when the graphs have to be customized in some way, they are likely to find they have much more freedom and can manage much more customization with a programming language than they could have with spreadsheet. In this way, programming languages resemble Huffman coding trees that are more well balanced than more task specific programs.
The analogy with Huffman coding trees does not only extend to programming languages but other kinds of interfaces as well. Consider a simple user interface. If a certain task is more common, we can choose to make a button to perform that task more prominent than others perhaps by making it bigger or placing it at the top of a list. By doing this, we have made the other capabilities of the interface a bit harder to find. In this sense there is an encoding for the action and other actions have a longer encoding.
Aug 17, 2011
Old Dog, New Trick
I've been using integration by parts lately to solve some unique problems. Unfortunately, it seems many people don't seem to think there is anything really interesting about it. I would like to show here a simple example of some of its more complicated things I've done with it recently.
First to start off with a quick definition of the integration by parts transformation.

This transformation is kinda useful for numerical integration as well. If you look at the right hand side, you'll see that a always appears integrated. For this reason, we can use this interpretation of the integral whenever the integral of a is better behaved than a itself. Take this integral as an example:

This equation has no analytic solution and becomes very difficult to analyse numerically around 0. In fact a simple attempt to numerically integrate it won't give good results.

The oscillations are due to that problematic sine term. The amazing thing is how much better behaved the integral of sine(1/x) is than the original expression. The integral has an analytic solution in terms of the Cosine Integral function: http://mathworld.wolfram.com/CosineIntegral.html. This function is not difficult to numerically approximate.
We can then make this integral easier to solve numerically by applying the integration by parts transformation. "a" here will be Sin(1/x) and "b" will be the exponential. First we compute the Integral of a. First I define the integral of the oscillating function:

Here Ci is the previously mentioned CosineIntegral function. The full transformed integral is:

oI still oscillates, but not as widely as the previous function. This integral is easy to evaluate numerically. If we take out the analytic component and just focus on the integral, we can see we basically just transformed the function in the graph above into an analytically evaluable expression and the integral of this function:
 I'm always kind of amazed what kinds of functions this technique can be applied to.
First to start off with a quick definition of the integration by parts transformation.
This transformation is kinda useful for numerical integration as well. If you look at the right hand side, you'll see that a always appears integrated. For this reason, we can use this interpretation of the integral whenever the integral of a is better behaved than a itself. Take this integral as an example:
This equation has no analytic solution and becomes very difficult to analyse numerically around 0. In fact a simple attempt to numerically integrate it won't give good results.

We can then make this integral easier to solve numerically by applying the integration by parts transformation. "a" here will be Sin(1/x) and "b" will be the exponential. First we compute the Integral of a. First I define the integral of the oscillating function:
Here Ci is the previously mentioned CosineIntegral function. The full transformed integral is:
oI still oscillates, but not as widely as the previous function. This integral is easy to evaluate numerically. If we take out the analytic component and just focus on the integral, we can see we basically just transformed the function in the graph above into an analytically evaluable expression and the integral of this function:

Aug 7, 2011
Some fun consequences of the previous post on Cauchy distributions
Look at my kinda rant on stack exchange here.
Essentially, the theory of diversification for stocks is completely different if you assume that the differentials of stocks are Cauchy distributed instead of Normally distributed. In fact, as I kinda point out, diversification doesn't even seem to make any sense under the conditions that stocks are levy processes.
There were a number of good answers and its gonna take me a while to go through the recommended reading.
Essentially, the theory of diversification for stocks is completely different if you assume that the differentials of stocks are Cauchy distributed instead of Normally distributed. In fact, as I kinda point out, diversification doesn't even seem to make any sense under the conditions that stocks are levy processes.
There were a number of good answers and its gonna take me a while to go through the recommended reading.
Aug 1, 2011
Stocks are not Wiener Processes.
The controversy over the distribution that best fits the change of stock prices is apparently fairly recent. In turns out that stocks are actually Levy processes. I was stumbled across this fact while trying to fit the data onto the normal distribution and failing. Having read somewhere that the differential in stock prices is normal (see Black Sholes model), I assumed it would be at least a reasonable fit. After failing, I programmatically tried a ton of random distributions till a suitable fit was found.
Here is a histogram of the daily closing differences for General Electric. On top of it is superimposed a fit of the histogram with first the Normal distribution and then the Cauchy distribution. The fit was found using maximum likelihood estimation.

Of course this is not proof that the differential is Cauchy distributed. For that however you have to simply look at the properties of each distribution. For example the sum of two Cauchy random variables is another Cauchy random variable with parameters equal to the sum of the two previous parameters. Define beforehand the properties of stocks and you can derive the behavior of the distribution which should match it.
Using the normal distribution is fine if you are making some kind of approximation. However whenever an approximation is made, you have to ask how good it will be and under what conditions it fails. It looks like this hasn´t been seriously tried until recently.
Here is a histogram of the daily closing differences for General Electric. On top of it is superimposed a fit of the histogram with first the Normal distribution and then the Cauchy distribution. The fit was found using maximum likelihood estimation.

One of these is a better fit. Which do you think?
It blows my mind how terrible of a fit the Normal distribution is - why did it take Mandelbrot and Nassim Taleb to bring this fact up? In fact, running a simple test for normality on the data shows an incredibly small chance of it being normally distributed.
Of course this is not proof that the differential is Cauchy distributed. For that however you have to simply look at the properties of each distribution. For example the sum of two Cauchy random variables is another Cauchy random variable with parameters equal to the sum of the two previous parameters. Define beforehand the properties of stocks and you can derive the behavior of the distribution which should match it.
Using the normal distribution is fine if you are making some kind of approximation. However whenever an approximation is made, you have to ask how good it will be and under what conditions it fails. It looks like this hasn´t been seriously tried until recently.
Jul 22, 2011
Analog Planimeter
I recently got one of these for my birthday:

http://www.math.ucsd.edu/~jeggers/Planimeter/KE_4242_1930/KE_4242_1930_gallery.html
It´s called a planimeter - a simple device which is used to calculate the area of an arbitrary blob. What is incredible is how simple the device is. At it's most basic, it is nothing more than two joined sticks and small wheel. It works because of Green's theorem, which is basically just the fundamental theorem of calculus (see post below). The fundamental theorem of calculus is everywhere. Mathematical!
The one I have is exactly like the one in the gallery above. It´s a 1930´s German manufactured planimeter. How did I come across this? About half a year ago, I was wandering in the beautiful stacks of the Math library at the University of Illinois. It might be one of the more interesting libraries around. The library is modeled on the throne room at Neushwarstein Castle of King Ludwig II of Bavaria, has dangerous translucent glass floors, and pictures of famous mathematicians whose gaze is at times very unnerving. The book collection isn't bad either. Although it is though a very small library by the university´s standards, they have a pile of books every month that they give away.
These days, the books are usually on some obscure branch of analysis and almost always in Cyrillic. I happened to find a book on the subject of Graphical and Mechanical Computation however. This book was of practical use at the time of its publication, but the direction of our progress has made the techniques nothing more than curiosities. It's such a shame that progress has caused us to abandon such a beautiful technology. Fortunately, Google has preserved the book at the link above. I learned about the planimeter in some of the later chapters.
Maybe there is new interest in the subject. John D Cook recently reviewed this book on Nomology, a form of graphical numerical computation. I guess I have now another book to add to my shelf now...
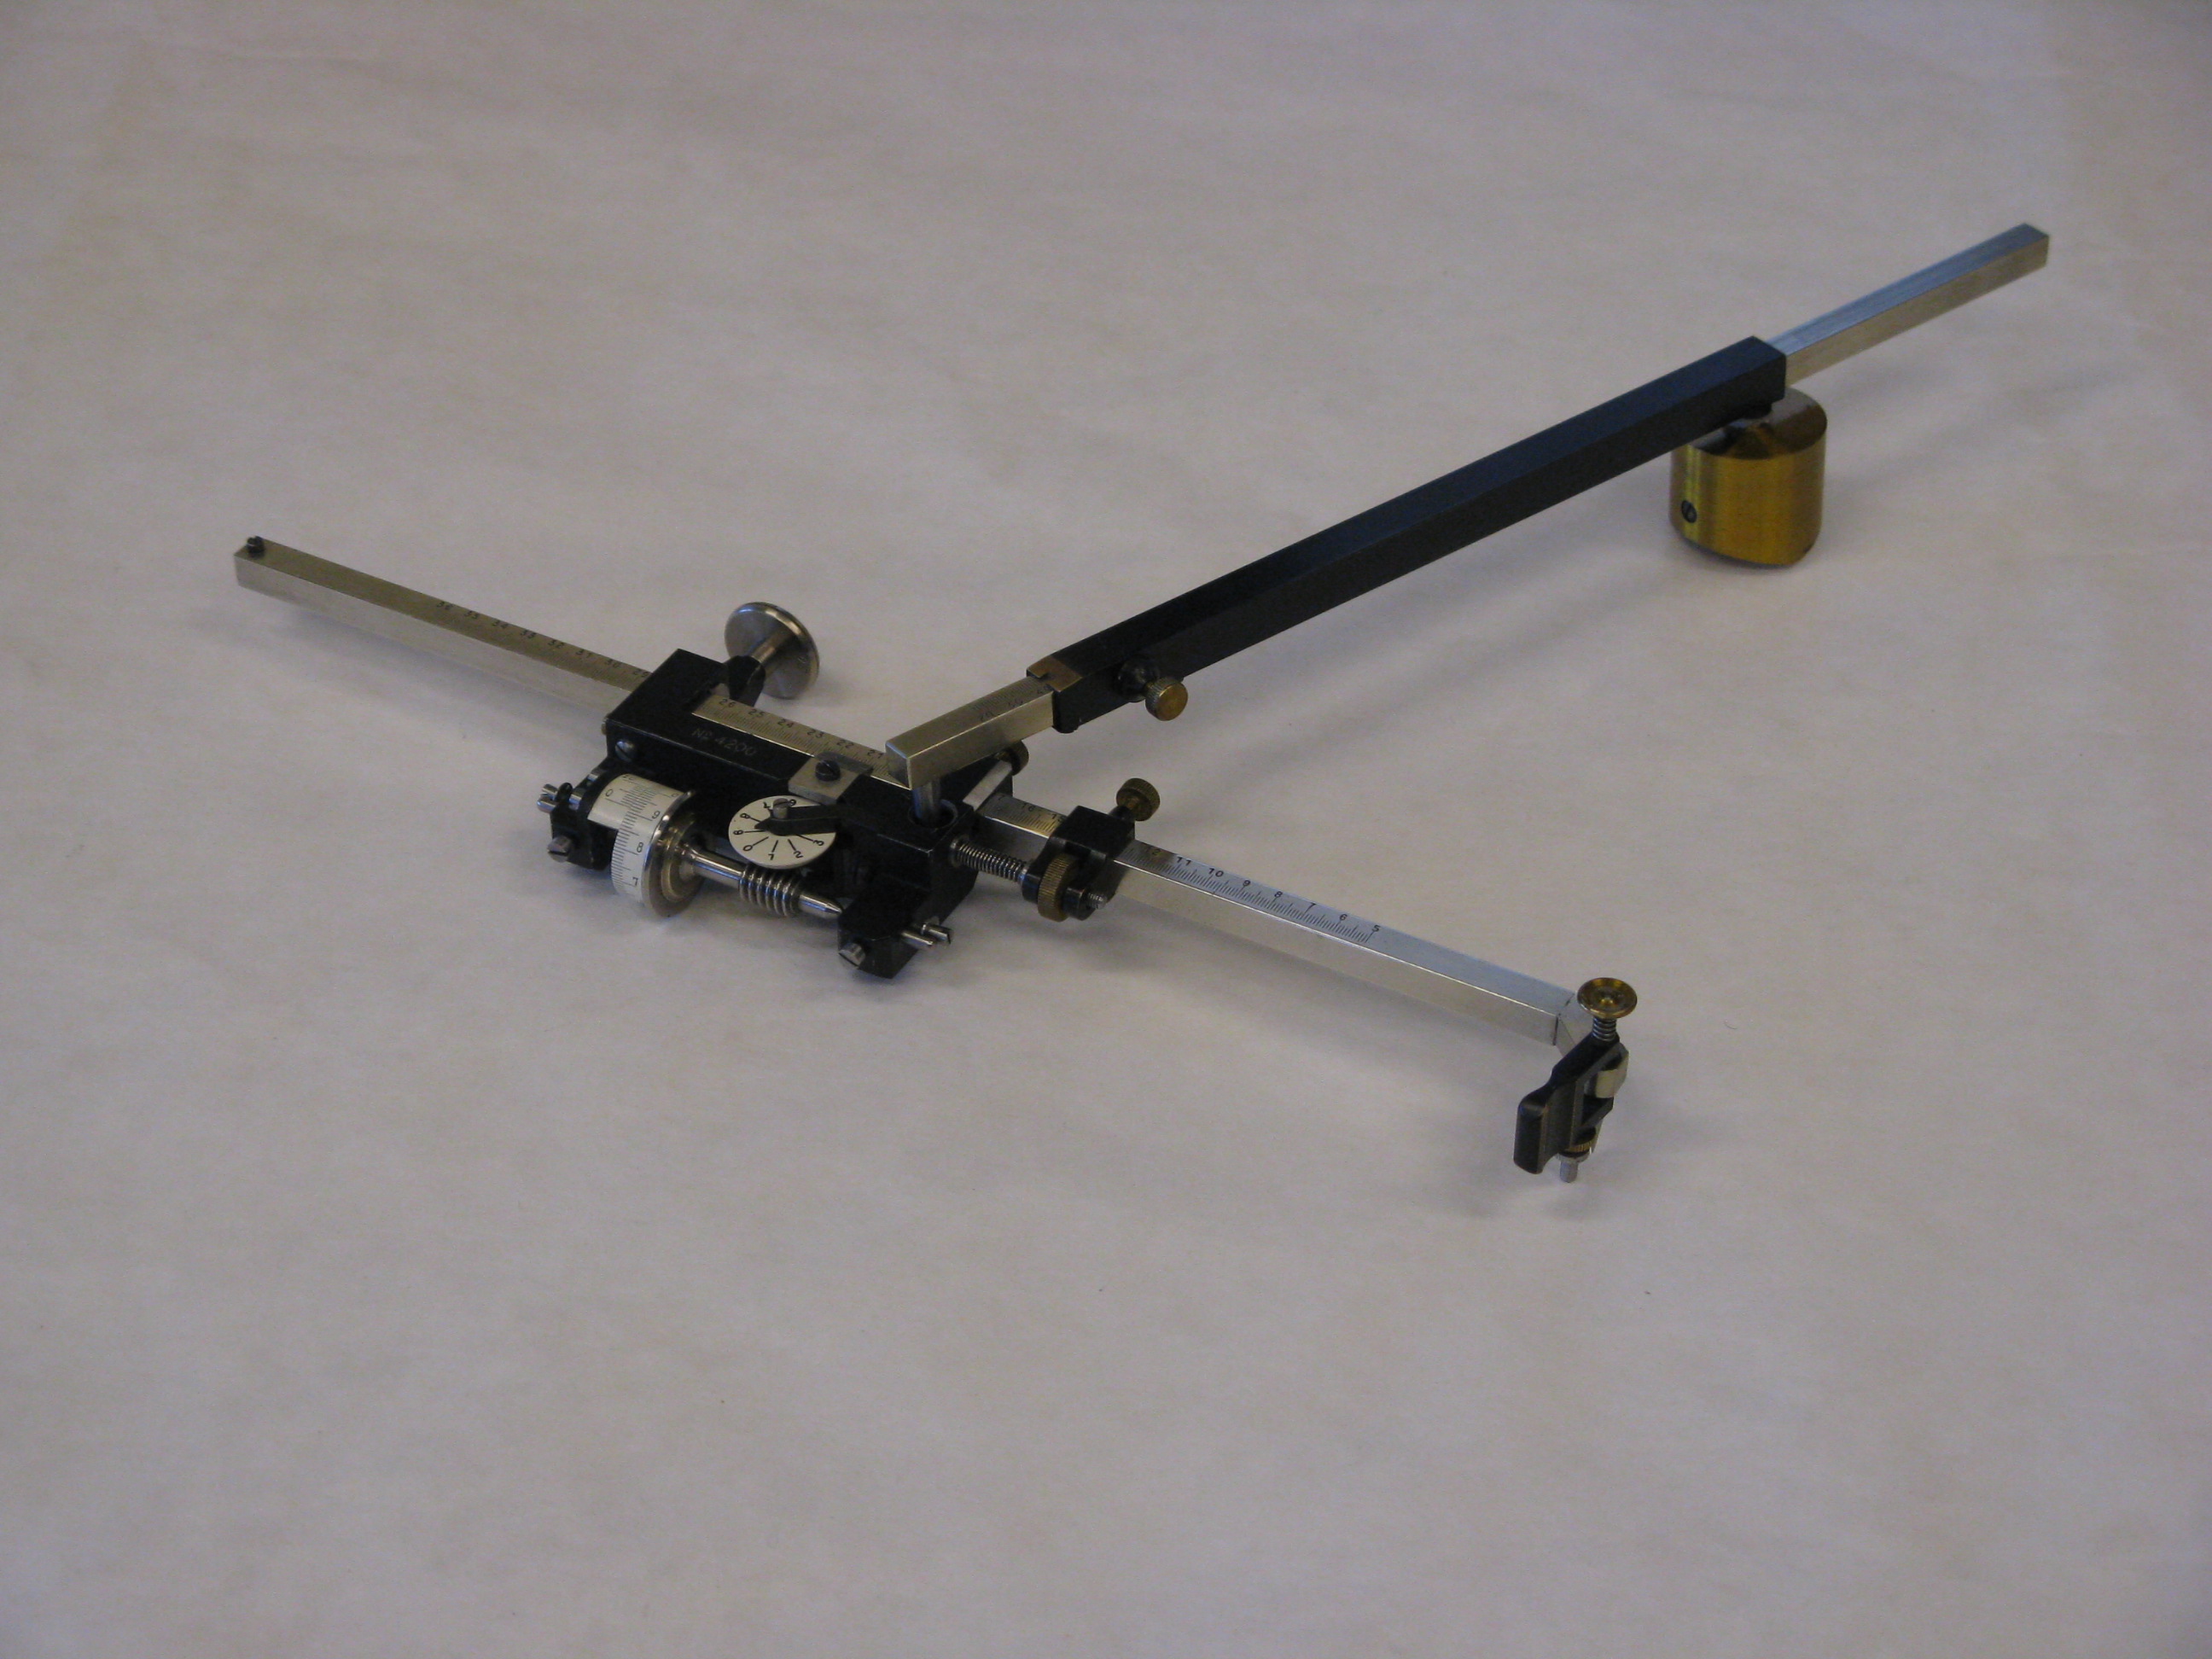
http://www.math.ucsd.edu/~jeggers/Planimeter/KE_4242_1930/KE_4242_1930_gallery.html
It´s called a planimeter - a simple device which is used to calculate the area of an arbitrary blob. What is incredible is how simple the device is. At it's most basic, it is nothing more than two joined sticks and small wheel. It works because of Green's theorem, which is basically just the fundamental theorem of calculus (see post below). The fundamental theorem of calculus is everywhere. Mathematical!
The one I have is exactly like the one in the gallery above. It´s a 1930´s German manufactured planimeter. How did I come across this? About half a year ago, I was wandering in the beautiful stacks of the Math library at the University of Illinois. It might be one of the more interesting libraries around. The library is modeled on the throne room at Neushwarstein Castle of King Ludwig II of Bavaria, has dangerous translucent glass floors, and pictures of famous mathematicians whose gaze is at times very unnerving. The book collection isn't bad either. Although it is though a very small library by the university´s standards, they have a pile of books every month that they give away.
These days, the books are usually on some obscure branch of analysis and almost always in Cyrillic. I happened to find a book on the subject of Graphical and Mechanical Computation however. This book was of practical use at the time of its publication, but the direction of our progress has made the techniques nothing more than curiosities. It's such a shame that progress has caused us to abandon such a beautiful technology. Fortunately, Google has preserved the book at the link above. I learned about the planimeter in some of the later chapters.
Maybe there is new interest in the subject. John D Cook recently reviewed this book on Nomology, a form of graphical numerical computation. I guess I have now another book to add to my shelf now...
Jul 13, 2011
Incarnations of the Fundamental Theorem of Calculus.
I'm not sure most people know how very often the fundamental theorem of calculus comes up. I'm even more surprised how many people are hard pressed to be able to describe it, even if they work in a technical field were calculus is used.
The fundamental theorem of calculus basically says that deriving the rate of change of something and finding integrating the area are like ying/yang hot/cold addition/subtraction. They're complementary and undo each other.
Anyway, I'm writing this because I think I've stumbled across a kinda unintuitive result of it that shows how widespread this duality between area and rate is. I was looking at program written in Mathematica and came across the following snippet:
Mean@Differences@list
This code takes the mean of the differences of a list of numbers called list. The differences are simply the differences in the adjacent numbers: First minus Second, Second minus Third, and so on. The mean is just the average of them. The code here is inefficient. A small amount of algebra shows that there is a quicker way to compute this value than to take all of the differences and then take their means.
Let's say that our list of numbers is (a,b,c,d,e,f). Then our list of differences is (a-b,b-c,c-d,d-e,e-f). To average them, we add them all up and divide by the length of the list which is 6:
(a-b+b-c+c-d+d-e+e-f)/6
which is equal to (a-f)/6
It's not too hard to see. This result however is essentially just the fundamental theorem of calculus. This fact is not as clear - after all, there are no derivatives and integrals really used. They are discrete versions however and they are hidden in the actual problem.
First, the Differences function is a kind of discrete derivative. It is changing our list of numbers into a list of the rate of changes in the numbers. Rate of change is essentially just a derivative.
The second thing is that taking the mean of a set of numbers is kinda like integrating. In fact, most people will remember that you can take the average value of a continuous function by integrating it and dividing by the range over which you are averaging.
Putting these two together shows that they undo each other. The integral from a to z of a derivative is just the original function evaluated at a minus it evaluated at z. We divide by the length of the z-a to get the average.
Actually the correspondence between the difference operator and differentiation is kinda fun in general:
http://en.wikipedia.org/wiki/Difference_operator
The fundamental theorem of calculus basically says that deriving the rate of change of something and finding integrating the area are like ying/yang hot/cold addition/subtraction. They're complementary and undo each other.
Anyway, I'm writing this because I think I've stumbled across a kinda unintuitive result of it that shows how widespread this duality between area and rate is. I was looking at program written in Mathematica and came across the following snippet:
Mean@Differences@list
This code takes the mean of the differences of a list of numbers called list. The differences are simply the differences in the adjacent numbers: First minus Second, Second minus Third, and so on. The mean is just the average of them. The code here is inefficient. A small amount of algebra shows that there is a quicker way to compute this value than to take all of the differences and then take their means.
Let's say that our list of numbers is (a,b,c,d,e,f). Then our list of differences is (a-b,b-c,c-d,d-e,e-f). To average them, we add them all up and divide by the length of the list which is 6:
(a-b+b-c+c-d+d-e+e-f)/6
which is equal to (a-f)/6
It's not too hard to see. This result however is essentially just the fundamental theorem of calculus. This fact is not as clear - after all, there are no derivatives and integrals really used. They are discrete versions however and they are hidden in the actual problem.
First, the Differences function is a kind of discrete derivative. It is changing our list of numbers into a list of the rate of changes in the numbers. Rate of change is essentially just a derivative.
The second thing is that taking the mean of a set of numbers is kinda like integrating. In fact, most people will remember that you can take the average value of a continuous function by integrating it and dividing by the range over which you are averaging.
Putting these two together shows that they undo each other. The integral from a to z of a derivative is just the original function evaluated at a minus it evaluated at z. We divide by the length of the z-a to get the average.
Actually the correspondence between the difference operator and differentiation is kinda fun in general:
http://en.wikipedia.org/wiki/Difference_operator
Jul 4, 2011
Literature Reading Plan
First, the word "Plan" really shouldn't be here. In fact, I've chosen the title simply so I could I can write about how my grand book reading plan is actually an un-plan. I don't want to give the impression that I've created a regime and book reading list based on the great authors. Instead, the plan is an emergent behavior - I read books I've bought by wandering around aimlessly at bookstores without any kind of timetable. I read books which are around me compulsively. This plan is a pattern which has emerged without intention in my life.
The books aren't all things I have fun reading. In most cases, I would really prefer to be reading about math. There are a number of books on I've acquired by way of recommendation or I've prescribed to myself because I feel like they will be good for me.
I would have never been able to do this in college. Being compelled to read and lie about your views on one novel kills all of the energy needed to really read at least two or three of them. I'm amazed The
Here's a short list of the some of the types I've been reading over the past year:
Kurt Vonnegut
- TimeQuake
- Sirens of Titan
Like half of everything David Sedaris has written. "The Kid" by Dan Savage.
Haruki Murakami
- Reread Underground
- Blind Willow, Sleeping Women
- Wind-up bird Chronicle
The Catcher in the Rye
and a bunch of others I've forgotten or didn't feel were worth any comment. Overall, this list is a bit more impressive than I would have thought it would be a year ago.
I think Murakami and Vonnegut are a specific kind of reading for me. Reading abusrdist literature makes you more creative. It also probably makes you more likely to go insane, but the two are closely linked.
The other identifiable trend in my reading is clearly gay literature. Savage's work is more centrally about being gay than Sedaris's comedy. Both however are fairly important to me for being gay works. I feel like I could be easily criticized for being a gay guy reading gay literature for sake of being gay.
gay gay gay gay gay gay gay
However it is important to me to see a reflection of my life in literature. Growing up, I never saw people living out gay lives. I know a number of people who would say that I shouldn't need media like TV, radio, and books to tell me how to live, but those people always had a reflection of their lives available to them wherever they wanted it. Maybe Asian Americans feel the same way to a degree reading Amy Tan. I feel like the need to be represented in literature is kind of universal. People who don't see their own troubles reflected in books likely are not reading.
Subscribe to:
Posts (Atom)